Resistance is defined as a change in the sensitivity of a pest population to a pesticide, resulting in the failure of a correct application of the pesticide to control the pest. Resistance can develop when the same pesticide or similar ones with the same mode of action are used over and over again. It often is thought that pests change or mutate to become resistant. However, it is not the individual pest (insect, weed, or microorganism) that changes, but the population. When a pesticide is applied to a crop or treatment site, a tiny proportion of the pest population (for example, one insect or weed in 10 million) may survive exposure to the pesticide due to its genetic makeup. When the pests that survive breed, some of their young will inherit the genetic trait that confers resistance to the pesticide. These pests will not be affected the next time a similar pesticide is used. If the same pesticide is applied often, the proportion of less-susceptible individuals in the population will increase. When the pesticide applicator recognizes that the once-highly-effective pesticide no longer controls the pest at the same rate, higher rates and more frequent applications become necessary until eventually, the pesticide provides little or no control. The population may then be said to have become resistant. The illustration on the right shows how a resistant weed can dominate a field treated with the same herbicide year after year.
The green symbols represent the wild type, or susceptible, weeds and the red or orange symbols represent the resistant ones. If a herbicide is applied in this first year it would kill the susceptible plants, but miss the few resistant ones. This will result in good seed production from the resistant plants but little seed produced by the susceptible plants. As a result, there is a small increase in the percentage of resistant plants in Year 2.
If the same herbicide is applied once again, there will be little seed produced by the susceptible plants, but the resistant plants will continue to set seed. This results in an increase in the percentage of resistant weeds in Year 3. With the repeated use of the same herbicide, there is a greater increase in the percentage of resistant weeds with most of the population resistant by Year 5. Although the genetic factor(s) may differ among pests that have become resistant, all cases of resistance are driven by this process of selection. More specific definitions and mechanisms of pesticide resistance often apply to particular classes of pesticides. This module treats each major type of pesticide resistance (insecticide, herbicide, and fungicide), and the methods that can be used to prevent or manage it, separately.
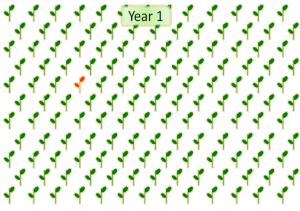 YEAR 1: A resistant population begins with as little as one resistant pest. (Shown in orange) |
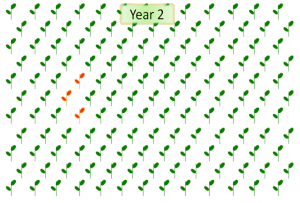 YEAR 2 |
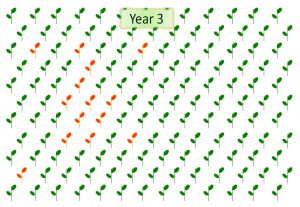 YEAR 3 |
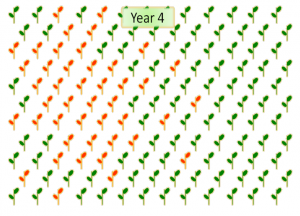 YEAR 4 |
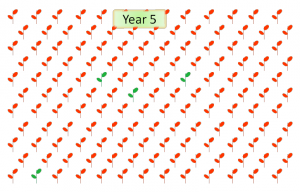 YEAR 5: Over time, the number of resistant individuals increases until the entire population is resistant to the pesticide that is used to control them. (Images courtesy Dr. Alan York, NCSU) |
Compiled by Dr. Wayne Buhler, PhD
![]()